Fire Alarm Zone Charts for Fast Emergency Response
Quick Answer: Fire alarm zone charts map which parts of a site should respond during an emergency. They guide responders to the right floor, room, or bay, reduce confusion, and speed evacuation and fire attack decisions. When these charts stay accurate, they help protect people, assets, and operations.
In a real incident, every second counts. That is why fire alarm zones and the charts that describe them matter so much. At industrial sites, retail centres, and commercial facilities across Australia, these charts help teams pinpoint where alarms originate and what equipment should act. In other words, they turn a chaotic event into a controlled response.
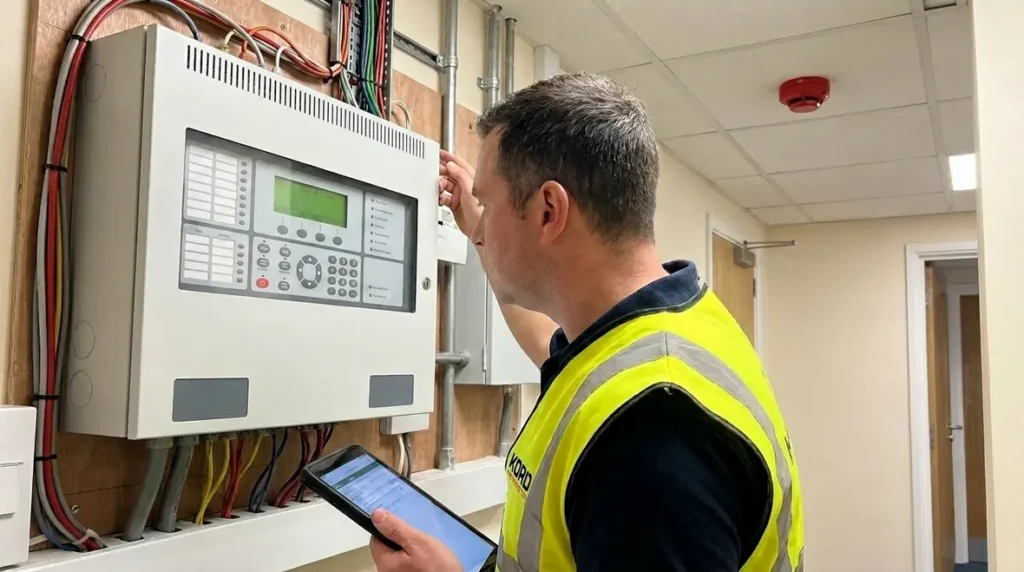
And yes, a fire alarm panel can be loud. But the zone chart makes that noise useful instead of just dramatic. If your broader setup includes fire alarm systems, the chart is what helps people make sense of what the panel is trying to say in the middle of a stressful moment. Now, let’s break down what these charts do, why they matter during an emergency, and how Kord Fire Protection can act as a vital partner in getting your system ready before anything goes wrong.
Before the sirens, lights, and hurried radio calls start stealing the spotlight, it helps to remember one simple truth: documentation is part of the emergency response. A site can have detectors, strobes, panels, interfaces, and procedures, but if people cannot quickly translate an alarm into a real place, the response slows down right when it should speed up. That is why zone charts are not decorative paperwork. They are operational tools.

What fire alarm zone charts do during an emergency
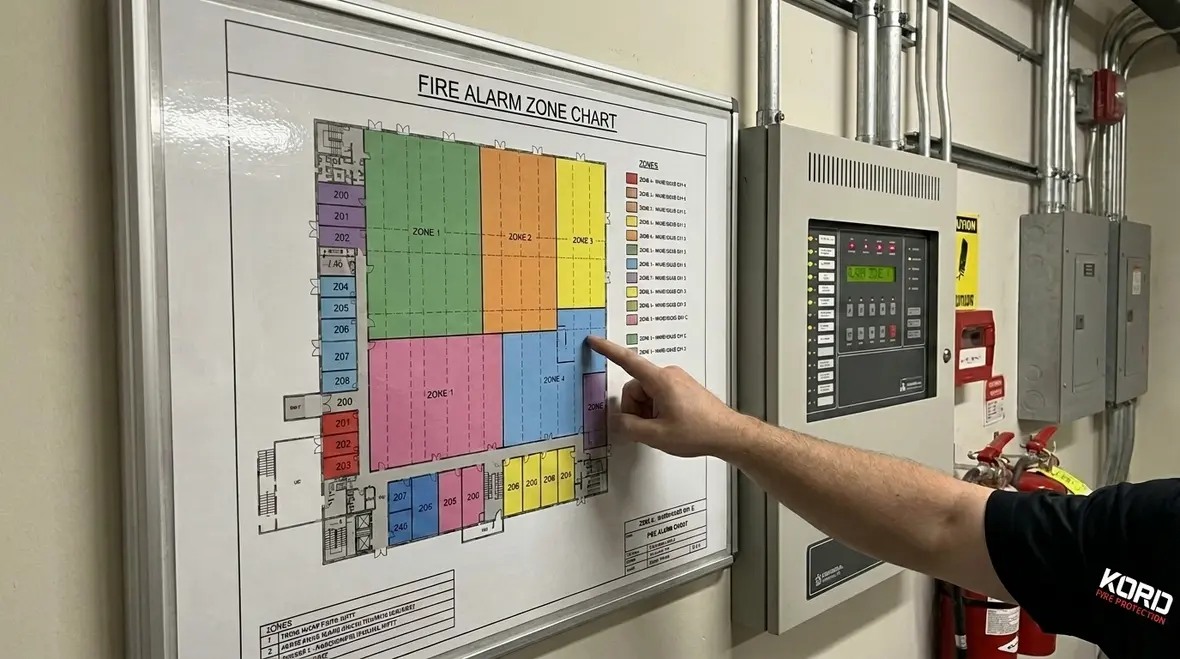
Fire alarm zone charts translate panel signals into human directions. When a detector activates, the system reports the zone. Then the chart tells your people what that zone covers. As a result, staff can act with less guesswork, and responders can confirm the location quickly.
For example, consider a warehouse with multiple bays and racking lines. Without clear zone mapping, an alarm could feel like it is coming from everywhere. However, with correct fire alarm zones, the chart can show the specific bay, corridor, or service area. Then staff can guide occupants to the correct route and keep traffic out of the impacted area.
Moreover, the charts support the broader emergency workflow. They help security decide whether to stop certain processes, isolate equipment, or coordinate access. In retail, they help managers understand whether an alarm relates to a back-of-house store room, a plant room, or a customer-facing zone.
Why the chart matters even before responders arrive
The first few moments after activation are often handled by the people already on site. That could be a facility manager, a chief warden, a shift supervisor, security staff, or a store manager who definitely did not plan to become a detective at 9:14 on a Tuesday morning. A zone chart gives those people an immediate reference point so they can verify the likely location, communicate clearly, and avoid sending everyone in three different directions at once.
This is also where accurate site documents support confidence. People respond better when they trust the information in front of them. If the chart has been kept current, teams can act quickly. If it looks old, vague, or disconnected from the actual layout, hesitation creeps in. Hesitation is not ideal when the building is already trying to make a very loud point.
How zones reduce delays, confusion, and “everyone panic at once” moments
During an emergency, people do not just need information. They need the right information fast. Fire alarm zones reduce decision time because teams do not have to interpret device addresses while smoke, noise, and stress pile up.
Additionally, zone charts improve coordination between parties. When firefighters arrive, they need a clear picture of building coverage. If the site has reliable documentation, responders can form a quicker plan. Then they can focus on verification rather than detective work.
Fire safety teams also rely on these details for internal actions. For instance, evacuation procedures often differ by area. Staff must know which zones relate to protected exits, stairwells, and any staged evacuation plan. If zones and charts drift out of date, the plan becomes a guess. And in emergencies, guesses tend to age badly.
Clear zoning helps communication stay clear too
A strong zone chart improves more than movement. It improves language. Instead of saying, “I think it is somewhere near the back area next to that room with the roller door,” staff can refer to a named area tied to a zone. That makes radio calls cleaner, handovers faster, and decisions more consistent. When multiple teams are involved, shared language is not a nice extra. It is part of control.

Where zoning details make or break operations
Zones matter most where sites change often. Industrial environments expand, retrofit, and reconfigure. Retail spaces remodel. Commercial buildings adjust tenancy layouts. Therefore, the chart must match reality.
Here are common places where mismatches create risk and downtime:
- New partitions and tenancies: If a contractor adds rooms but the chart does not update, staff may ignore the correct alarm area.
- Updated plant rooms: When HVAC work or electrical upgrades occur, zones may be reassigned by technicians.
- Warehouse rack and aisle changes: Relocation of detectors changes coverage boundaries, so charts need verification.
- Service corridors and ceiling voids: Ceilings get refurbished, then coverage can shift without obvious signs.
Just as important, the chart affects testing and maintenance. When teams test the system, they must confirm that the correct zone responds. Otherwise, the site ends up with “paper compliance,” which feels like passing a test while checking the answers later. It happens more than people like to admit.
Why operational drift quietly creates risk
Most zone chart problems do not start with one dramatic mistake. They build gradually. A fit-out changes one tenancy. A plant room gets upgraded. A service space is renamed. A wall moves. A detector gets relocated. Then six months later, the chart still looks neat on the wall while reality has already wandered off in another direction. That kind of drift is easy to miss during normal days and painfully obvious during abnormal ones.
For sites managing several safety services at once, accurate documentation often supports better coordination across related systems as well. Even something as routine as monitoring expectations can connect back to how clearly staff understand where an event is occurring and what should happen next. Good charts help those decisions stay grounded in the actual building rather than in wishful thinking.
What a strong zone chart includes for fast response
A practical fire alarm zone chart focuses on what people need in the moment. It should map zones to clear physical areas. Also, it should match how your staff talk about the site, not how an engineer labels components.
A strong chart typically includes:
- Zone-to-area mapping: Names for floors, buildings, departments, and specific rooms or bays.
- Detector or device identifiers: Enough detail for maintenance teams to verify quickly.
- Panel and device reference points: So crews can correlate alarm signals without confusion.
- Operational notes: Any relevant actions such as where access is restricted or where hazards exist.
- Version control: A way to confirm the latest layout and updates.
Then there is the human factor. Staff need charts that are easy to use under stress. Therefore, layouts should be readable at a glance, and the chart should connect to your emergency procedures.
That means labels should be familiar, directional cues should make sense, and the document should avoid stuffing too much technical detail into the same space. The goal is not to win an award for complexity. The goal is to help a human being standing in front of a panel understand where to go and what that area means right now.
How Kord Fire Protection helps keep zones accurate across Australia
Many businesses do not fail at fire safety because they do not care. They fail because systems change faster than documentation. Kord Fire Protection supports facilities that must stay operational while upgrades happen, and that need confidence their fire alarm zones reflect the real site.
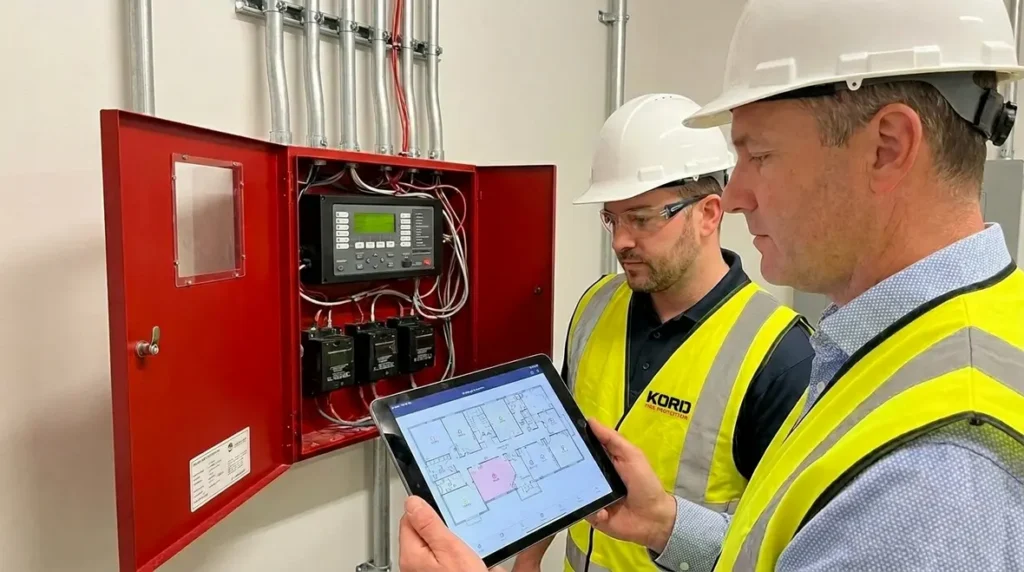
As a partner, Kord Fire Protection can help in practical ways such as reviewing existing documentation, verifying zoning boundaries, and aligning charts with the installed system. Then they can assist with updates after changes, so your emergency teams rely on facts, not outdated diagrams.
Because industrial, retail, and commercial sites across Australia vary widely, a one-size approach rarely works. Kord Fire Protection can tailor the zone chart process to each facility’s layout and how staff respond during alarms. As a result, your site gains smoother coordination, faster location confirmation, and fewer “who’s responsible for this area?” delays.
In short, if your charts are the map, Kord Fire Protection helps make sure the map matches the road. And while pop quizzes are fine for school, they are not fun during emergencies.
Support that fits changing sites
Sites rarely stay still. That is especially true in warehouses, large retail footprints, and commercial properties where tenancy shifts, internal refurbishments, and service upgrades happen over time. Support is most useful when it accounts for those moving parts and helps bring documents, panel logic, and staff understanding back into alignment after each change.
Testing, training, and updates that keep zones trustworthy
A zone chart only helps if people use it and if it stays current. Therefore, sites benefit from routine verification, maintenance alignment, and staff training that reinforces the chart’s purpose.
First, teams should test and confirm that a triggered device reports the correct fire alarm zone. Then they should validate that staff understand the chart and know where to look during an alarm.
Next, updates should trigger chart review. Whenever building works happen, the responsible parties should confirm whether the system coverage changed. After that, the chart version should update, and staff should receive a short refresh so response actions stay consistent.
Finally, training should focus on real scenarios. Teams can practice how to read the zone chart quickly, how to direct responders, and how to secure areas without blocking access. When this stays consistent, the emergency response becomes calmer, faster, and far more reliable.
It also helps to treat zone charts as live documents rather than static compliance artifacts. Build review points into maintenance routines. Check them after refurbishments. Confirm them during drills. Ask staff whether the labels still match how the site actually operates. Small review habits can prevent very large misunderstandings later.
FAQ
Conclusion
Fire alarm zone charts turn alarm signals into clear directions when it matters most. They reduce confusion, speed up site actions, and help responders verify the source with less delay. For industrial, retail, and commercial facilities across Australia, accuracy must stay current as layouts change. Kord Fire Protection helps keep your documentation aligned with your installed system. If you want fewer surprises during an emergency, contact Kord Fire Protection today.